DAX Strategie Performance Report
Performance Data and Trades 2024 - Today
Total Trades: 29
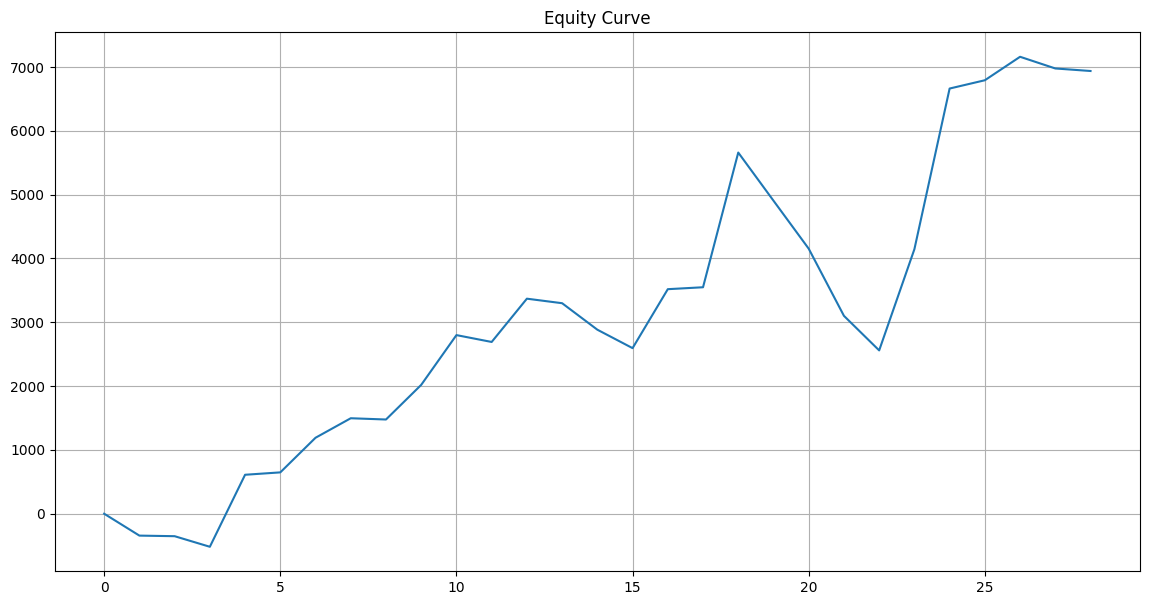
Total Points: 7350.54
Points per Trade: 253.47
| Entry Date | Entry Price | Exit Date | Exit Price | Type | Points |
|---|---|---|---|---|---|
| 2024-01-11 | 16547.03 | 2024-01-24 | 16889.92 | Short | -342.89 |
| 2024-01-24 | 16889.92 | 2024-02-13 | 16880.83 | Long | -9.09 |
| 2024-02-13 | 16880.83 | 2024-02-15 | 17046.69 | Short | -165.86 |
| 2024-02-15 | 17046.69 | 2024-04-05 | 18175.04 | Long | 1128.35 |
| 2024-04-05 | 18175.04 | 2024-04-23 | 18137.65 | Short | 37.39 |
| 2024-04-23 | 18137.65 | 2024-05-22 | 18680.2 | Long | 542.55 |
| 2024-05-22 | 18680.2 | 2024-07-03 | 18374.53 | Short | 305.67 |
| 2024-07-03 | 18374.53 | 2024-07-18 | 18354.76 | Long | -19.77 |
| 2024-07-18 | 18354.76 | 2024-08-13 | 17812.05 | Short | 542.71 |
| 2024-08-13 | 17812.05 | 2024-09-04 | 18591.85 | Long | 779.8 |
| 2024-09-04 | 18591.85 | 2024-09-13 | 18699.4 | Short | -107.55 |
| 2024-09-13 | 18699.4 | 2024-10-23 | 19377.62 | Long | 678.22 |
| 2024-10-23 | 19377.62 | 2024-11-11 | 19448.6 | Short | -70.98 |
| 2024-11-11 | 19448.6 | 2024-11-12 | 19033.64 | Long | -414.96 |
| 2024-11-12 | 19033.64 | 2024-11-22 | 19322.59 | Short | -288.95 |
| 2024-11-22 | 19322.59 | 2024-12-17 | 20246.37 | Long | 923.78 |
| 2024-12-17 | 20246.37 | 2025-01-06 | 20216.19 | Short | 30.18 |
| 2025-01-06 | 20216.19 | 2025-03-04 | 22326.81 | Long | 2110.62 |
| 2025-03-04 | 22326.81 | 2025-03-05 | 23081.03 | Short | -754.22 |
| 2025-03-05 | 23081.03 | 2025-03-11 | 22328.77 | Long | -752.26 |
| 2025-03-11 | 22328.77 | 2025-03-18 | 23380.7 | Short | -1051.93 |
| 2025-03-18 | 23380.7 | 2025-03-26 | 22839.03 | Long | -541.67 |
| 2025-03-26 | 22839.03 | 2025-04-15 | 21253.7 | Short | 1585.33 |
| 2025-04-15 | 21253.7 | 2025-06-12 | 23771.45 | Long | 2517.75 |
| 2025-06-12 | 23771.45 | 2025-06-24 | 23641.58 | Short | 129.87 |
| 2025-06-24 | 23641.58 | 2025-07-16 | 24009.38 | Long | 367.8 |
| 2025-07-16 | 24009.38 | 2025-08-07 | 24192.5 | Short | -183.12 |
| 2025-08-07 | 24192.5 | 2025-08-26 | 24152.87 | Long | -39.63 |
| 2025-08-26 | 24152.87 | 2025-09-26 | 23739.47 | Short | 413.4 |
Entry Signals with Stop-Loss
| Date | Signal Price | Type | Stop-Loss |
|---|---|---|---|
| 2024-01-11 | 16547.03 | Sell | 16963.47 |
| 2024-01-24 | 16889.92 | Buy | 16345.02 |
| 2024-02-13 | 16880.83 | Sell | 17049.52 |
| 2024-02-15 | 17046.69 | Buy | 16831.53 |
| 2024-04-05 | 18175.04 | Sell | 18567.16 |
| 2024-04-23 | 18137.65 | Buy | 17626.9 |
| 2024-05-22 | 18680.2 | Sell | 18892.92 |
| 2024-07-03 | 18374.53 | Buy | 18030.49 |
| 2024-07-18 | 18354.76 | Sell | 18779.4 |
| 2024-08-13 | 17812.05 | Buy | 17024.82 |
| 2024-09-04 | 18591.85 | Sell | 18990.78 |
| 2024-09-13 | 18699.4 | Buy | 18208.84 |
| 2024-10-23 | 19377.62 | Sell | 19674.68 |
| 2024-11-11 | 19448.6 | Buy | 19004.97 |
| 2024-11-12 | 19033.64 | Sell | 19563.97 |
| 2024-11-22 | 19322.59 | Buy | 18812.53 |
| 2024-12-17 | 20246.37 | Sell | 20522.82 |
| 2025-01-06 | 20216.19 | Buy | 19649.87 |
| 2025-03-04 | 22326.81 | Sell | 23307.97 |
| 2025-03-05 | 23081.03 | Buy | 22235.26 |
| 2025-03-11 | 22328.77 | Sell | 23475.88 |
| 2025-03-18 | 23380.7 | Buy | 22258.3 |
| 2025-03-26 | 22839.03 | Sell | 23476.01 |
| 2025-04-15 | 21253.7 | Buy | 18489.91 |
| 2025-06-12 | 23771.45 | Sell | 24479.42 |
| 2025-06-24 | 23641.58 | Buy | 23051.55 |
| 2025-07-16 | 24009.38 | Sell | 24639.1 |
| 2025-08-07 | 24192.5 | Buy | 23380.94 |
| 2025-08-26 | 24152.87 | Sell | 24536.11 |
| 2025-09-26 | 23739.47 | Buy | 23284.67 |
Auswertung der Trades 1 Punkt = 1 €
Zeitraum: 11.01.2024 – 26.09.2025 • 29 Trades • immer im Markt
Gesamt
Bruttogewinn12.093,42 €
Bruttoverlust4.742,88 €
Netto-PnL7.350,54 €
Profitfaktor2,550
Trefferquote51,72 %
Ø je Trade (Erwartungswert)253,47 €
Ø Gewinn / Ø Verlust806,23 € / 338,78 €
Payoff-Ratio2,380
Bester / Schlechtester Trade2.517,75 € / −1.051,93 €
Max. Drawdown (Equity)3.100,08 €
Max. Gewinn-/Verlustserie4 / 4
Gesamt-/Ø Haltedauer624 Tage / 21,52 Tage
StdAbw je Trade801,59 €
Sharpe ≈ Mean/Std0,316
Long (14 Trades)
Netto-PnL7.271,49 €
Trefferquote57,14 %
Profitfaktor5,091
Ø Gewinn / Ø Verlust1.131,11 € / 296,23 €
Payoff-Ratio3,818
Ø Haltedauer26,57 Tage
Ø je Trade519,39 €
Short (15 Trades)
Netto-PnL79,05 €
Trefferquote46,67 %
Profitfaktor1,027
Ø Gewinn / Ø Verlust434,94 € / 370,69 €
Payoff-Ratio1,173
Ø Haltedauer16,80 Tage
Ø je Trade5,27 €
Kurzfazit
- Edge liegt klar auf Long (PF 5,09; hohe Ø-Gewinne). Shorts sind nahezu flat.
- Erwartungswert ~253 € pro Trade bei max. DD ~3,1k €.
- Verbesserungen: ATR/Trend-Filter für Shorts, Session-Filter, Trailing/BE-Feintuning.
Hinweis
Berechnung direkt aus obiger Liste (29 Trades). Bei 1 Punkt = 1 €. Keine Gebühren/Slippage berücksichtigt.